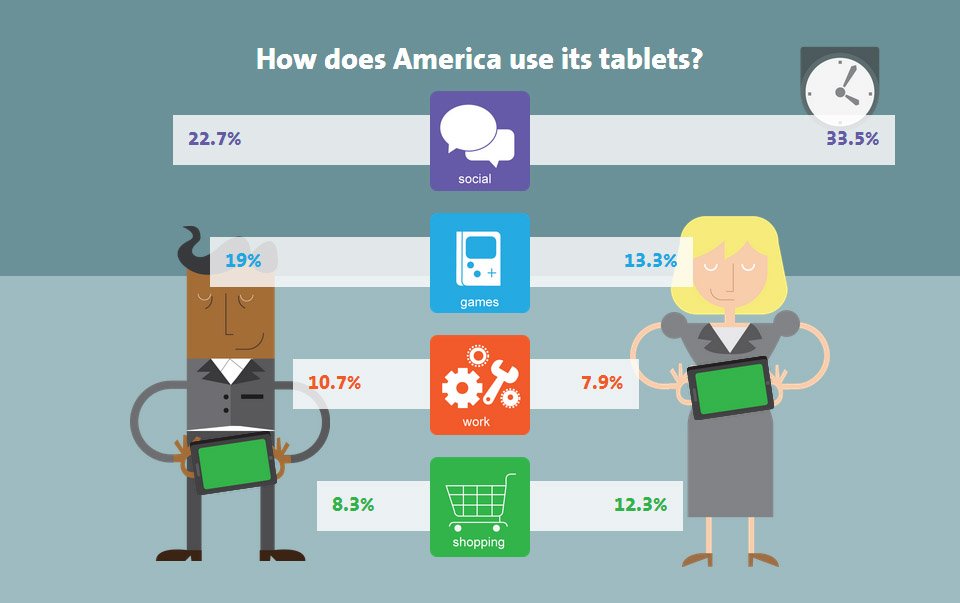
How long U.S. users use their tablets ? where they are using ? and when ? A New Infographic aims to answer those questions, and more. It’s all about how people in the US are using their tablets, formatted as a timeline that starts in the morning.
As this isn’t an image file per se, but more like an interactive Web page, we can’t post it here in its entirety. So to view it make sure you head over to the Source link below.